

超参数优化-mcp
项目介绍
Optuna MCP 服务器



一个使用 Optuna 自动化优化和分析的 模型上下文协议 (MCP) 服务器。
<img width="840" alt="image" src="https://raw.githubusercontent.com/optuna/optuna-mcp/main/examples/sphere2d/images/sphere2d-6.png" />使用场景
Optuna MCP 服务器可以在以下使用场景中使用,例如:
- 大型语言模型的自动超参数优化
- 通过聊天界面交互式地分析 Optuna 的优化结果
- 优化其他 MCP 工具的输入和输出
详情请参阅 示例部分。
安装
Optuna MCP 服务器可以通过 uv 或 Docker 进行安装。
本节将解释如何安装 Optuna MCP 服务器,以 Claude Desktop 为例作为 MCP 客户端。
使用 uv
在开始安装过程之前,请从 Astral 安装 uv。
然后,将 Optuna MCP 服务器配置添加到 MCP 客户端。
要在 Claude Desktop 中包含它,请转到 Claude > 设置 > 开发者 > 编辑配置 > claude_desktop_config.json 并添加以下内容:
{
  "mcpServers": {
    "Optuna": {
      "command": "/path/to/uvx",
      "args": [
        "optuna-mcp"
      ]
    }
  }
}
此外,您还可以使用 --storage 参数指定 Optuna 存储以持久保存结果。
{
  "mcpServers": {
    "Optuna": {
      "command": "/path/to/uvx",
      "args": [
        "optuna-mcp",
        "--storage",
        "sqlite:///optuna.db"
      ]
    }
  }
}
添加后,请重启 Claude Desktop 应用程序。 有关 Claude Desktop 的更多信息,请查看 快速入门页面。
使用 Docker
您也可以使用 Docker 运行 Optuna MCP 服务器。确保您的机器上已安装并运行 Docker。
{
  "mcpServers": {
    "Optuna": {
      "command": "docker",
      "args": [
        "run",
        "-i",
        "--rm",
        "--net=host",
        "-v",
        "/PATH/TO/LOCAL/DIRECTORY/WHICH/INCLUDES/DB/FILE:/app/workspace",
        "optuna/optuna-mcp:latest",
        "--storage",
        "sqlite:////app/workspace/optuna.db"
      ]
    }
  }
}
Optuna MCP 提供的工具
Optuna MCP 提供了以下工具。 具体来说,它提供了 Optuna 的基本函数,如 Study、Trial、可视化和仪表板。 由于 MCP 客户端知道工具列表及其详细信息,用户无需记住这些细节。
Study
- create_study - 创建一个新的 Optuna 研究,给定研究名称和方向。
如果研究已经存在,则会简单加载。
study_name: 研究名称(字符串,必需)。directions: 优化的方向(最小化/最大化字面字符串列表,可选)。
- set_sampler - 为研究设置采样器。
name: 采样器的名称(字符串,必需)。
- get_all_study_names - 从存储获取所有研究名称。
- set_metric_names - 设置 metric_names。Metric_names 是用于区分每个目标值标签的。
metric_names: 每个目标的度量名称列表(字符串列表,必需)。
- get_metric_names - 获取 metric_names。
- 不需要参数。
- get_directions - 获取研究的方向。
- 不需要参数。
- get_trials - 获取所有试验的 CSV 格式。
- 不需要参数。
- best_trial - 获取最佳试验。
- 不需要参数。
- best_trials - 返回位于研究帕累托前沿的试验。
- 不需要参数。
Trial
- ask - 使用 Optuna 建议新的参数。
search_space: Optuna 的搜索空间(字典,必需)。
- tell - 报告试验的结果。
trial_number: 试验编号(整数,必需)。values: 试验的结果(浮点数或浮点数列表,必需)。
- set_trial_user_attr - 为试验设置用户属性。
trial_number: 试验编号(整数,必需)。key: 用户属性的键(字符串,必需)。value: 用户属性的值(任意类型,必需)。
- get_trial_user_attrs - 获取试验中的用户属性。
trial_number: 试验编号(整数,必需)。
可视化
- plot_optimization_history - 返回优化历史图作为图像。
target: 指定要显示的值的索引(整数,可选)。target_name: 轴标签上显示的目标名称(字符串,可选)。
- plot_hypervolume_history - 返回超体积历史图作为图像。
reference_point: 用于计算超体积的参考点列表(浮点数列表,必需)。
- plot_pareto_front - 返回多目标优化的帕累托前沿图作为图像。
target_names: 用作轴标题的对象名称列表(字符串列表,可选)。include_dominated_trials: 包括所有被支配试验的目标值的标志(布尔值,可选)。targets: 指定要显示的目标值的索引列表(整数列表,可选)。
- plot_contour - 返回轮廓图作为图像。
params: 要可视化的参数列表(字符串列表,可选)。target: 指定要显示的值的索引(整数,必需)。target_name: 显示在颜色条上的目标名称(字符串,必需)。
- plot_parallel_coordinate - 返回平行坐标图作为图像。
params: 要可视化的参数列表(字符串列表,可选)。target: 指定要显示的值的索引(整数,必需)。target_name: 显示在轴标签和图例上的目标名称(字符串,必需)。
- plot_slice - 返回切片图作为图像。
params: 要可视化的参数列表(字符串列表,可选)。target: 指定要显示的值的索引(整数,必需)。target_name: 显示在轴标签上的目标名称(字符串,必需)。
- plot_param_importances - 返回参数重要性图作为图像。
params: 要可视化的参数列表(字符串列表,可选)。target: 指定要显示的值的索引(整数/空,可选)。target_name: 显示在图例上的目标名称(字符串,必需)。
- plot_edf - 返回 EDF 图作为图像。
target: 指定要显示的值的索引(整数,必需)。target_name: 显示在轴标签上的目标名称(字符串,必需)。
- plot_timeline - 返回时间线图作为图像。
- 不需要参数。
- plot_rank - 返回排名图作为图像。
params: 要可视化的参数列表(字符串列表,可选)。target: 指定要显示的值的索引(整数,必需)。target_name: 显示在颜色条上的目标名称(字符串,必需)。
Web 仪表板
- launch_optuna_dashboard - 启动 Optuna 仪表板。
port: 服务器端口(整数,可选,默认:58080)。
示例
优化 2D-Sphere 函数
这里提供了一个简单的示例,用于优化 2D-Sphere 函数,包括示例提示和 LLM 响应摘要。
| 用户提示 | Claude 输出 |
|---|---|
| (启动 Claude Desktop) | <img alt="1" src="https://raw.githubusercontent.com/optuna/optuna-mcp/main/examples/sphere2d/images/sphere2d-1.png" /> |
| 请创建一个名为“Optimize-2D-Sphere”的 Optuna 研究,进行最小化。 | <img alt="2" src="https://raw.githubusercontent.com/optuna/optuna-mcp/main/examples/sphere2d/images/sphere2d-2.png" /> |
| 请建议两个在 [-1, 1] 范围内的浮点参数 x 和 y。 | <img alt="3" src="https://raw.githubusercontent.com/optuna/optuna-mcp/main/examples/sphere2d/images/sphere2d-3.png" /> |
| 请报告目标值 x**2 + y**2。为了计算该值,请使用 JavaScript 解释器,并且不要四舍五入。 | <img alt="4" src="https://raw.githubusercontent.com/optuna/optuna-mcp/main/examples/sphere2d/images/sphere2d-4.png" /> |
| 请建议另一组参数并评估它。 | <img alt="5" src="https://raw.githubusercontent.com/optuna/optuna-mcp/main/examples/sphere2d/images/sphere2d-5.png" /> |
| 请绘制迄今为止的优化历史。 | <img alt="6" src="https://raw.githubusercontent.com/optuna/optuna-mcp/main/examples/sphere2d/images/sphere2d-6.png" /> |
启动 Optuna 仪表板并分析优化结果
您还可以通过 MCP 服务器启动 Optuna 仪表板,以交互方式分析优化结果。
| 用户提示 | Claude 输出 |
|---|---|
| 请启动 Optuna 仪表板。 | <img alt="7" src="https://raw.githubusercontent.com/optuna/optuna-mcp/main/examples/optuna-dashboard/images/optuna-dashboard-1.png" /> |
默认情况下,Optuna 仪表板将在端口 58080 上启动。
您可以通过导航到 http://localhost:58080 在您的网络浏览器中访问它,如下所示:
<img alt="8" src="https://raw.githubusercontent.com/optuna/optuna-mcp/main/examples/optuna-dashboard/images/optuna-dashboard-2.png" />
Optuna 仪表板提供了各种可视化工具来分析优化结果,例如优化历史、参数重要性等。
优化 FFmpeg 编码参数
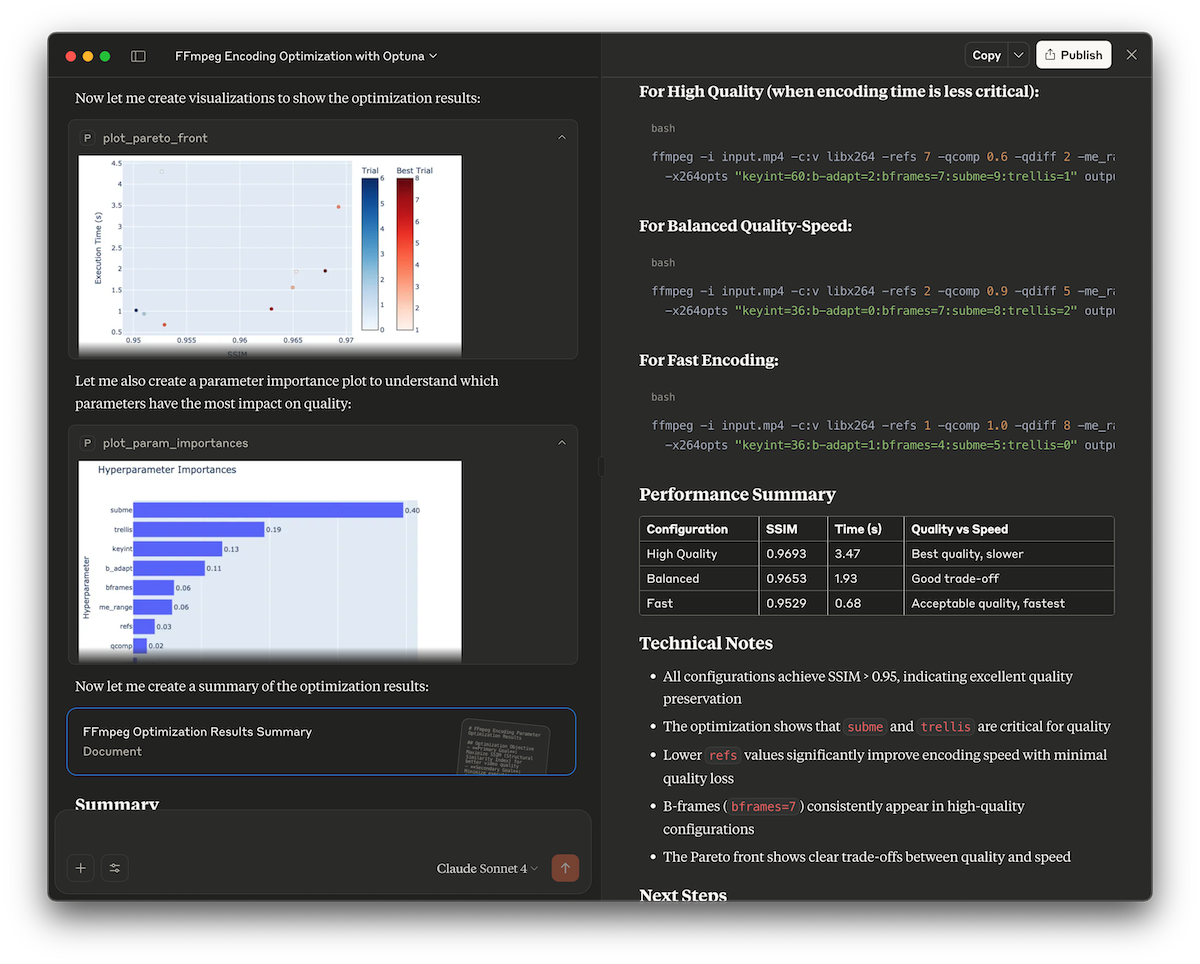
此演示展示了如何使用 Optuna MCP 服务器自动找到最优的 FFmpeg 编码参数。它优化了 x264 编码选项,以最大化视频质量(通过 SSIM 分数衡量),同时保持合理的编码时间。
详情请参阅 examples/ffmpeg。
优化饼干配方
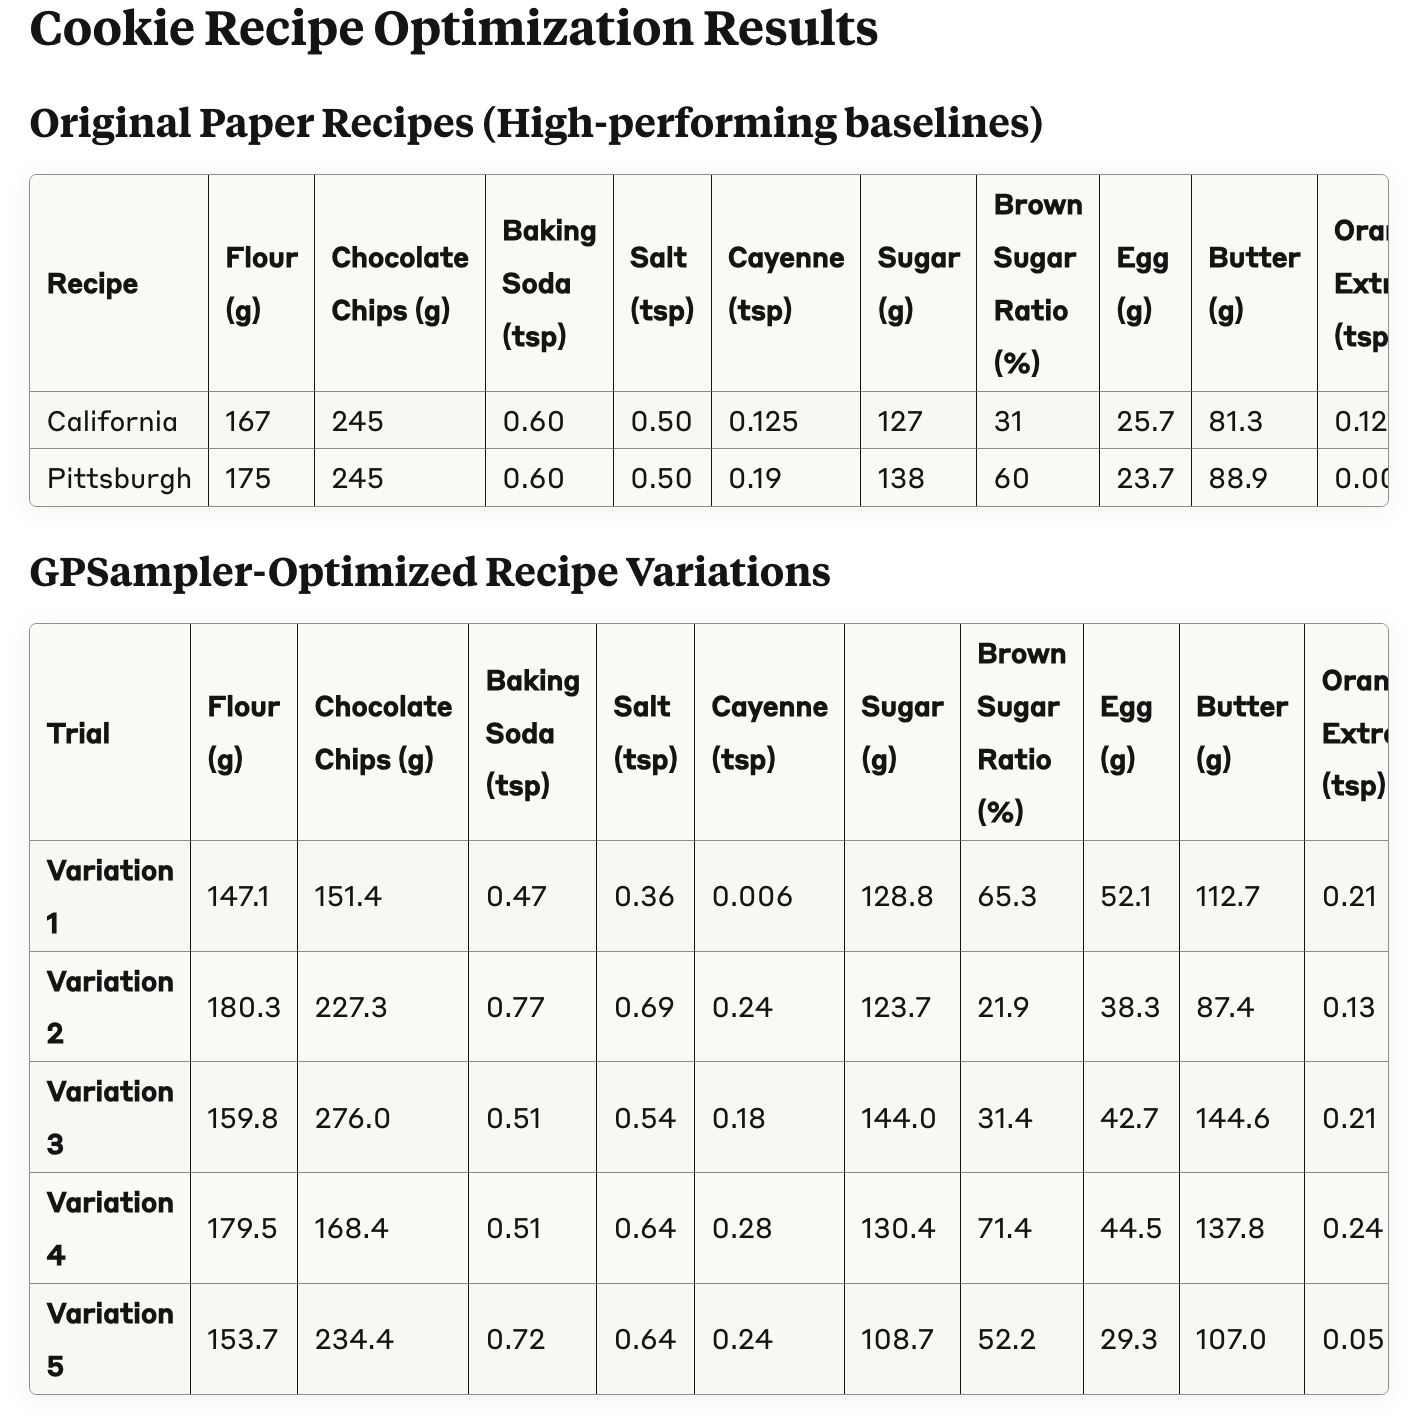
在此示例中,我们将优化饼干配方,参考论文《贝叶斯优化实现更好的甜品》。
详情请参阅 examples/cookie-recipe。
优化 Matplotlib 配置
<table> <caption>默认和由 Optuna MCP 优化的图形。</caption> <tr> <td><img src="https://gips2.baidu.com/it/u=1125771042,1365096009&fm=3081&app=3081&f=PNG?w=900&h=485" alt=""></td> <td><img src="https://gips2.baidu.com/it/u=734459851,1082389715&fm=3081&app=3081&f=PNG?w=900&h=527" alt=""></td> </tr> </table>此示例优化了 Matplotlib 配置。
详情请参阅 examples/auto-matplotlib。
许可证
MIT 许可证(见 LICENSE)。